CHAPTER 4
Chapter 4 - The Derivative
Section 4.1 - Rate of Change
In the previous chapter we studied
the mathematical relationship between an independent and dependent dimension.
The relationship expressed in the form of a mathematical function defines a
situation for a given set of conditions and properties. Since we allowed the
independent dimension to change, it was no longer a fixed quantity but became a
variable. The graph of the function reflected a horizontal change of the
independent variable with a vertical change in the dependent dimension. This
graph allows us to visualize how a situation changes with respect to a change in the conditions. This chapter
will focus on analyzing graphs and how they represent change.
To find out how much the function,
 , changes between two points
 , we simply enter in the two values for the independent
variable x and then calculate the difference between the dependent variable, f, for those given conditions. Remember
that a variable is nothing more than a dimension that is allowed to change or
take on any value. Thus, from
, we simply enter in the two values for the independent
variable x and then calculate the difference between the dependent variable, f, for those given conditions. Remember
that a variable is nothing more than a dimension that is allowed to change or
take on any value. Thus, from
 , the change in the independent variable , referred to as
 is:
is:

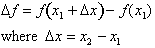
The corresponding change in the dependent
variable , referred to as
 is:
is:

 refers to an interval
over which we are analyzing the change in the dependent dimension, f. The second point
refers to an interval
over which we are analyzing the change in the dependent dimension, f. The second point
 can be written in
terms of the first point
can be written in
terms of the first point
 plus the change in
the variable,
plus the change in
the variable,

Therefore the
change in the dependent variable over an interval from
 to
to
 is
is
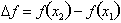 , which can also be written as:
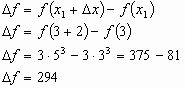
For example the change in the
function
 from x=3
to x=5 , where
from x=3
to x=5 , where  is 5 - 3 =
2 is:
is 5 - 3 =
2 is:
Questions
-
Hooke's law states that the force
required to stretch a spring is directly proportional to the amount stretched
or

F = Force
s = distance stretched
k = spring stiffness constant i.e Force required to stretch spring a unit distance
Graph this function for k=1000 N/m.
Calculate the change in force required to stretch the spring from 1m to 4 m.
-
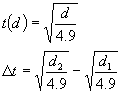
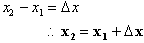
The distance a free-falling object
covers from an initial dropping point is given by the function:
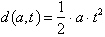 d=distance
Given
that acceleration is equal to gravity or
 , reduce the three dimensional function to one of
two-dimensions for time as a function of distance, d.
, reduce the three dimensional function to one of
two-dimensions for time as a function of distance, d.
Graph the function at intervals of
 , from d = 0 to d = 100m
Tabulate the corresponding change in time,
 , over each interval.
What can you conclude about the change in time covered between d = 10m and
d = 20m versus the change in time covered between d = 90 and d = 100m?
Next section ->
Section 4.2 - Average Rate of Change